BMI vs Body Fat Percentage: Which One Actually Matters?
RHC · Pre/Postnatal Fitness Specialist
Here's something worth knowing about BMI: it was developed in the 1830s by a Belgian mathematician studying populations, not individuals, and it was never designed to assess the health of any single person standing in front of you. Yet we use it exactly that way, in doctors' offices, gym inductions, and health apps. The result is a metric that routinely produces nonsense at the individual level: a muscular athlete flagged as "obese," a sedentary person with little muscle waved through as "normal weight." If you've ever found your BMI confusing or demoralising, the problem was never your body. It was the tool.
BMI and body fat percentage measure fundamentally different things, and knowing exactly what each one captures, and where each fails, changes how you should interpret your own numbers.
What BMI Actually Measures
Body Mass Index (BMI) is calculated as:
BMI = weight (kg) ÷ height (m)²
That's it. It takes your weight and divides it by your height squared. It does not distinguish between:
- Muscle and fat
- Bone density
- Fat distribution (where on your body fat is stored)
- Age-related body composition changes
- Sex differences in body composition
BMI categories:
| BMI | Category |
|---|---|
| Below 18.5 | Underweight |
| 18.5-24.9 | Normal weight |
| 25.0-29.9 | Overweight |
| 30.0+ | Obese |
BMI was originally developed by a Belgian mathematician, Adolphe Quetelet, in the 1830s as a statistical tool to study population averages, not as a clinical tool for individual health assessment. It was never designed to diagnose body composition or health risk in individuals.
What Body Fat Percentage Measures
Body fat percentage is the proportion of your total body weight that is composed of fat tissue. It is a direct measure of body composition.
Unlike BMI, body fat percentage distinguishes between fat mass and lean mass (muscle, bone, organs, water). Two people with identical heights and weights, and identical BMIs, can have dramatically different body fat percentages if one is muscular and one is not.
Healthy body fat percentage ranges:
| Category | Women | Men |
|---|---|---|
| Essential fat (minimum) | 10-13% | 2-5% |
| Athletic | 14-20% | 6-13% |
| Fitness | 21-24% | 14-17% |
| Acceptable | 25-31% | 18-24% |
| Obese | 32%+ | 25%+ |
Use our Body Fat Calculator to estimate your current body fat percentage.
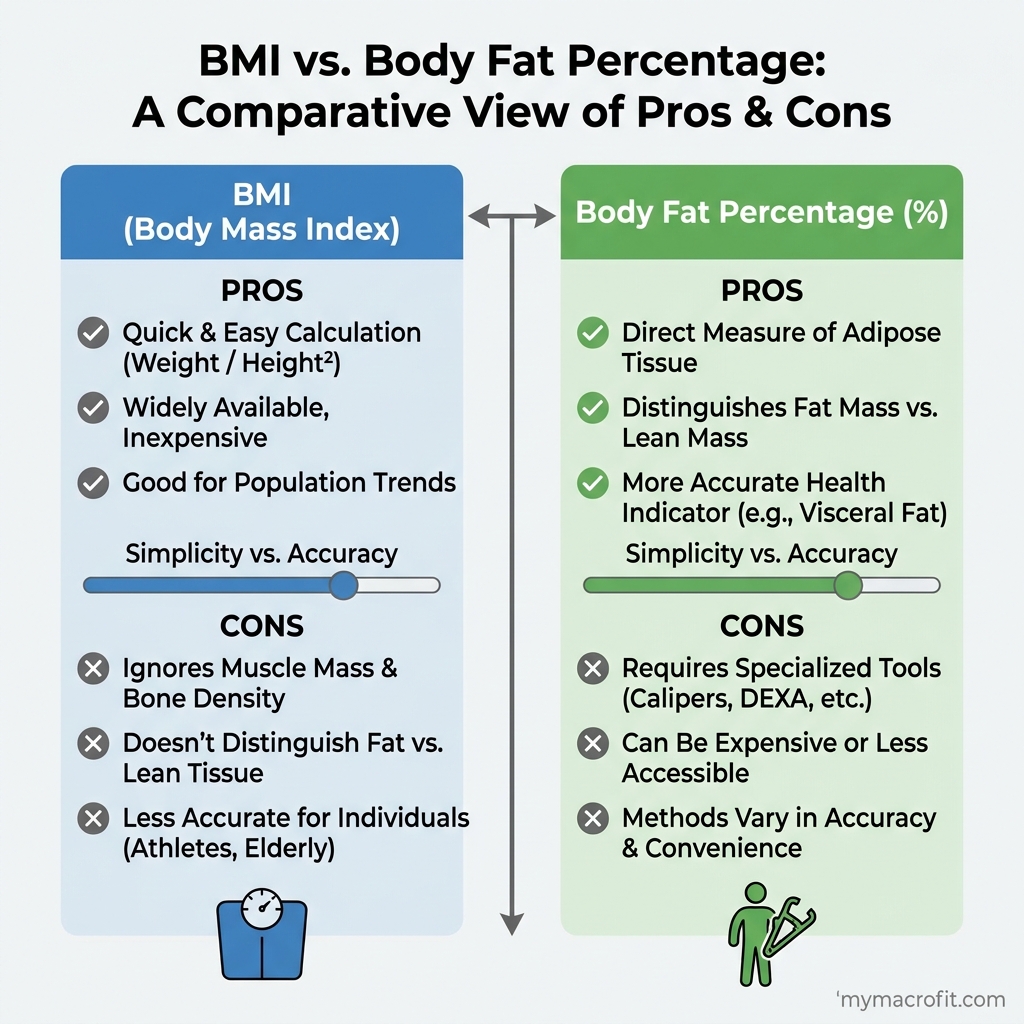
BMI vs Body Fat: A Direct Comparison
| Feature | BMI | Body Fat % |
|---|---|---|
| What it measures | Weight relative to height | Proportion of body that is fat |
| Accounts for muscle mass | No | Yes |
| Accounts for fat distribution | No | Partially |
| Requires measurement | Just weight and height | Requires additional measurement |
| Accuracy for individuals | Low to moderate | Moderate to high (depending on method) |
| Useful for populations | Yes | Less so |
| Useful for individuals | Limited | Much more useful |
| Tracks body composition changes | No | Yes |
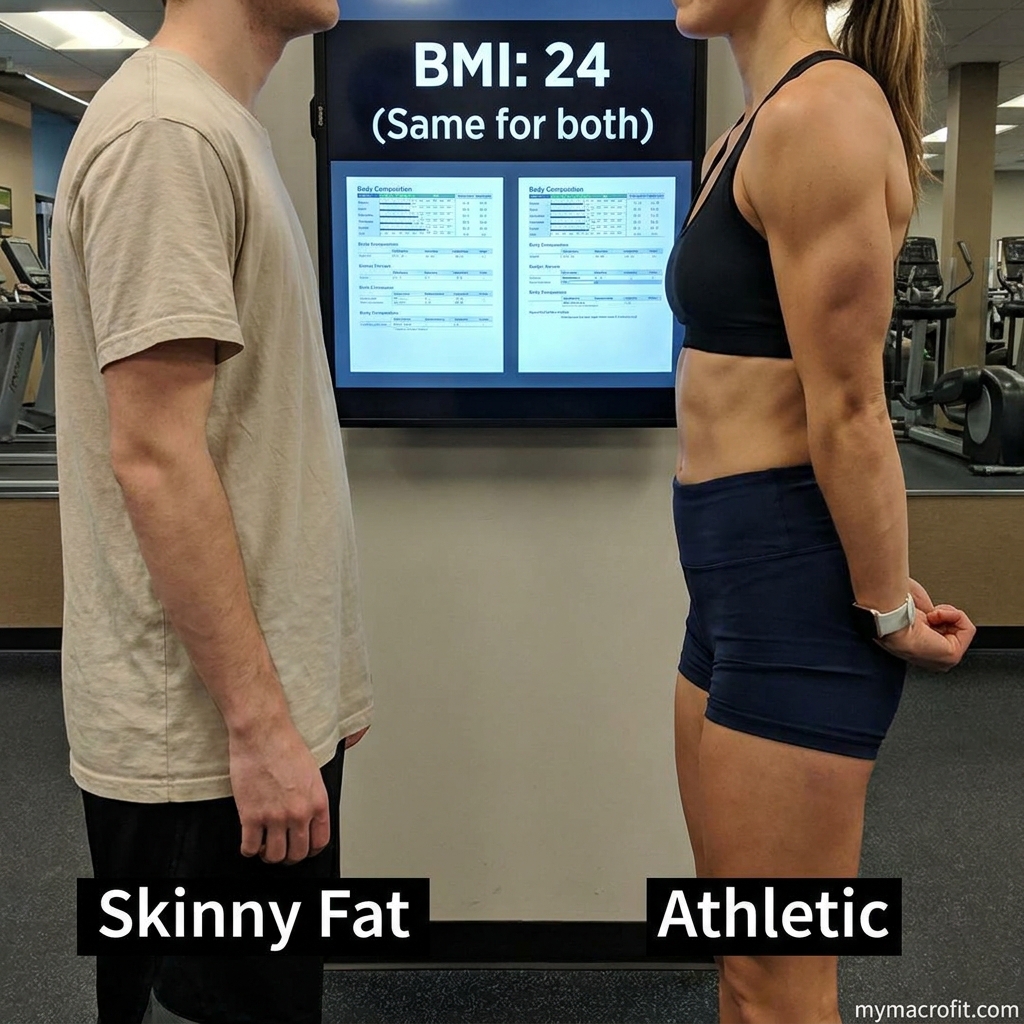
The Skinny Fat Problem
One of the clearest failures of BMI as a health tool is its inability to identify "skinny fat", a term for people who have a normal or low BMI but a high body fat percentage and low muscle mass.
A person of normal weight with 35% body fat has a very different health risk profile than a person of normal weight with 22% body fat, even though their BMIs might be identical. The high-body-fat person, despite normal weight:
- Has higher insulin resistance risk
- Greater cardiovascular risk
- Higher inflammatory markers
- Lower resting metabolic rate
- Greater visceral fat proportion
BMI sees them as "normal." Body fat percentage reveals the actual situation.
This is particularly relevant for women, in whom the phenomenon of high body fat at normal weight is common, especially after sedentary periods, post-pregnancy, or in the perimenopausal transition when muscle mass naturally declines.
The Opposite Problem: Muscular Individuals Classified as Overweight
At the other extreme, many muscular individuals have BMIs in the "overweight" or even "obese" category despite being extremely lean and fit. Muscle is denser than fat, an athlete with 12% body fat and significant muscle mass will weigh more than a sedentary person of the same height.
Using BMI to assess this person's health risk is not just inaccurate, it's backwards. Their cardiovascular fitness, insulin sensitivity, and metabolic health are likely excellent.
Which Should You Track?
For most people trying to improve their health, physique, or fitness performance, body fat percentage is the more useful metric. Here's why:
- It tells you whether changes in your weight are fat loss or muscle gain
- It provides a target (e.g., "get from 30% to 24%") that maps directly to what you actually want to achieve
- It reveals progress even when the scale doesn't move (body recomposition, losing fat and gaining muscle simultaneously, shows no weight change but significant body fat % reduction)
- It identifies health risks that BMI misses
When BMI is useful:
- Large-scale population health studies (BMI correlates with health outcomes at the population level, even if individual accuracy is low)
- Quick screening tool when no other measurement is available
- As one data point among several, not as a definitive assessment
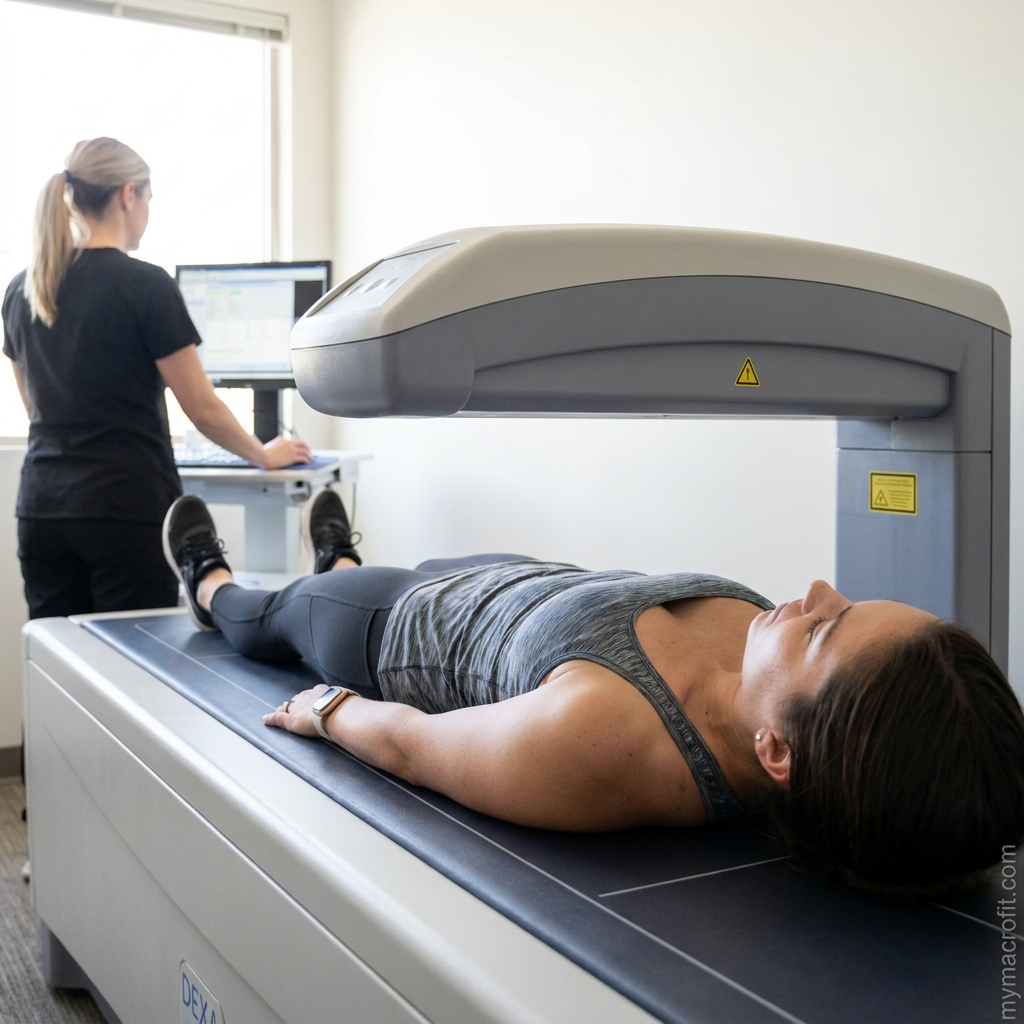
How to Measure Body Fat Percentage
Most accessible methods:
DEXA Scan, Gold standard. Uses low-dose X-ray to measure fat, muscle, and bone. Highly accurate, but requires clinical access and costs $50-$200 per scan.
Hydrostatic Weighing, Second most accurate. Requires complete submersion in water. Available at some universities and research centres.
Air Displacement Plethysmography (Bod Pod), Very accurate. Measures body volume using air displacement. Less commonly available.
Skinfold Calipers, Moderately accurate when performed by an experienced technician. Inexpensive and quick.
Bioelectrical Impedance Analysis (BIA), Found in smart scales and handheld devices. Convenient but accuracy varies significantly with hydration status. Useful for tracking trends rather than exact numbers.
Circumference-Based Formulas, Use body measurements (waist, hip, neck) to estimate body fat. Less accurate but free and accessible. Our Body Fat Calculator uses this method to give you a free estimate.
A Better Set of Health Metrics
Rather than relying on BMI alone, consider tracking:
| Metric | Why It Matters |
|---|---|
| Body fat percentage | Direct measure of body composition |
| Waist circumference | Correlates strongly with visceral fat and cardiovascular risk |
| Waist-to-hip ratio | Risk indicator for metabolic disease |
| Resting heart rate | Cardiovascular fitness indicator |
| Blood pressure | Direct health risk marker |
| Fasting blood glucose | Insulin sensitivity indicator |
| Strength benchmarks | Functional health and muscle mass proxy |
Of these, waist circumference is the most accessible and underused. A waist measurement above 88cm (35 inches) for women or 102cm (40 inches) for men is associated with significantly elevated cardiovascular and metabolic risk, regardless of BMI.
The Bottom Line
BMI is a convenient but blunt tool that tells you relatively little about your actual body composition or health risk. Body fat percentage is a more meaningful, actionable metric that distinguishes between fat and muscle, identifies risks that BMI misses, and tracks the changes that actually matter.
If you want to know where you stand, use our Body Fat Calculator to estimate your body fat percentage and compare it against the healthy range for your sex and age. Then use that number, not your BMI, to guide your goals.
Sources
- About Adult BMI, Centers for Disease Control and Prevention (CDC).
- Obesity, NHS.
- Assessing your weight and health risk, National Heart, Lung, and Blood Institute (NIH).
- Obesity and overweight, World Health Organization.
Save & share on Pinterest
Click any card to pin it — or share with someone who needs it.
BMI vs Body Fat Percentage: Which One Actually Matters?
BMI vs body fat percentage, what each actually measures, the limitations of BMI, the skinny fat prob…
BMI vs body fat percentage, what each actually measures, the limitations of BMI,…
Read the full guide: BMI vs Body Fat Percentage: Which One Actually Matters?
Try the free Body Fat Calculator
BMI vs Body Fat Percentage: Which One Actually Matters? — use our free calculators for instant perso…
Pinterest opens in a new tab. You can edit the description before saving.
Ready to get your numbers?
Free calculator, instant results, no signup required.
Frequently Asked Questions
Is BMI or body fat percentage more accurate?+
What is a healthy body fat percentage?+
Can you have a high BMI but low body fat?+
What is skinny fat?+
About the Author

I'm a registered health coach and pre/postnatal specialist. I look at the whole person, your sleep, your stress, your hormones, because the number on the scale is only ever part of the story.
View full profile →