The Complete Body Composition Guide: BMI, Body Fat, and What to Actually Track
RHC · Pre/Postnatal Fitness Specialist
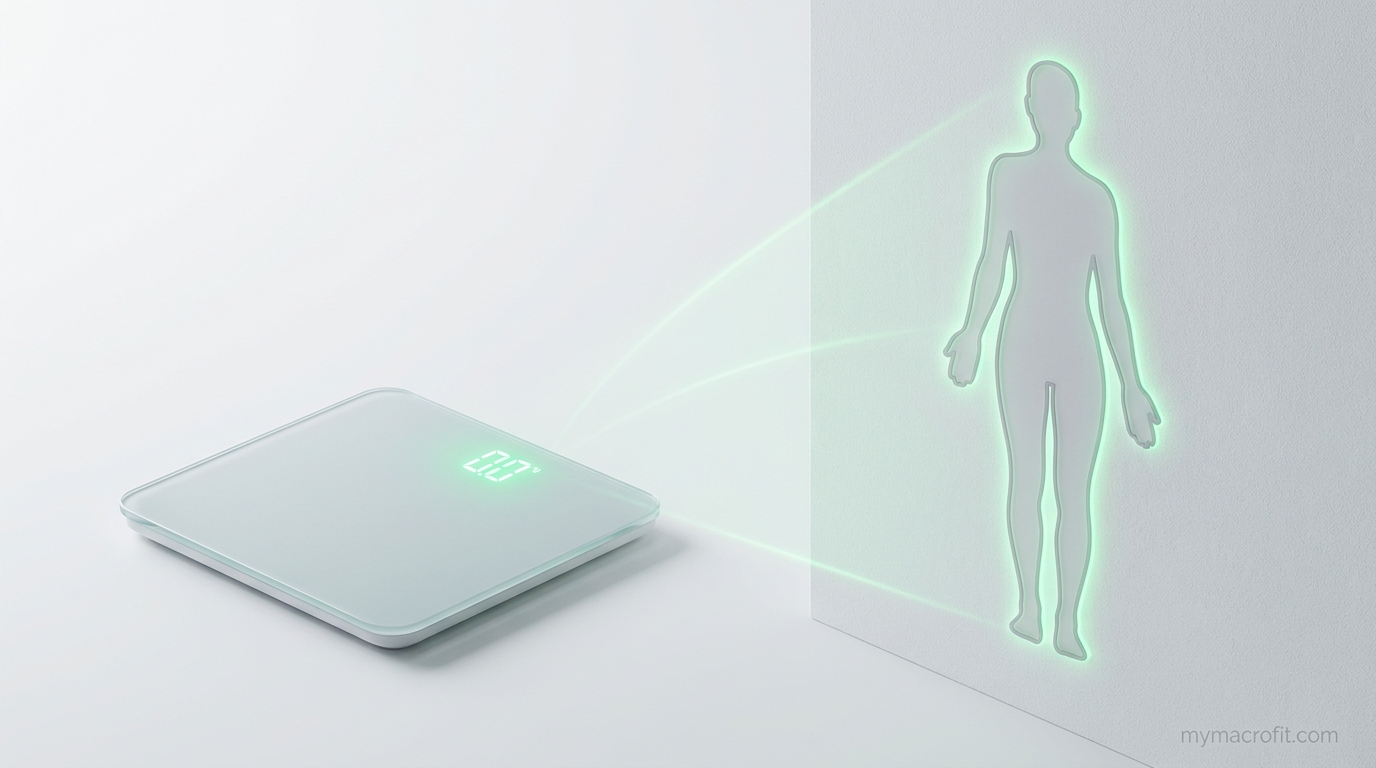
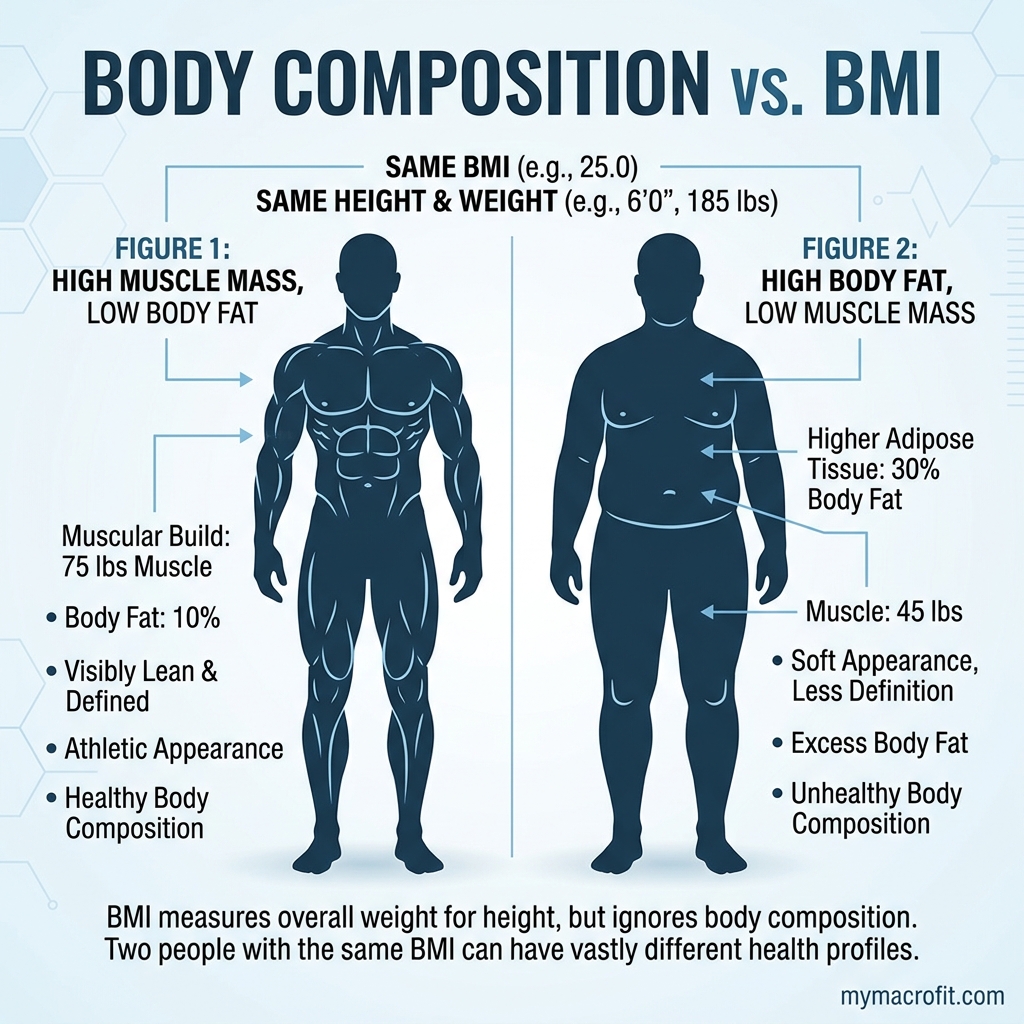
Here is one of the most useful truths in physiology, and one the bathroom scale will never tell you: your body weight is a remarkably poor measure of your body. Consider two women, both 65kg. One carries 30% body fat, the other 22%. They look dramatically different, they have measurably different metabolic health risks, and they need entirely different training and nutrition approaches. Yet step them both on a scale, or run their BMI, and the numbers are identical. The scale is blind to the thing that actually matters.
That thing is body composition: the ratio of fat mass to lean mass that determines how you look, how you perform, and a great deal about your long-term health. This guide explains precisely what it is, how to measure it accurately, and what the evidence says about changing it.
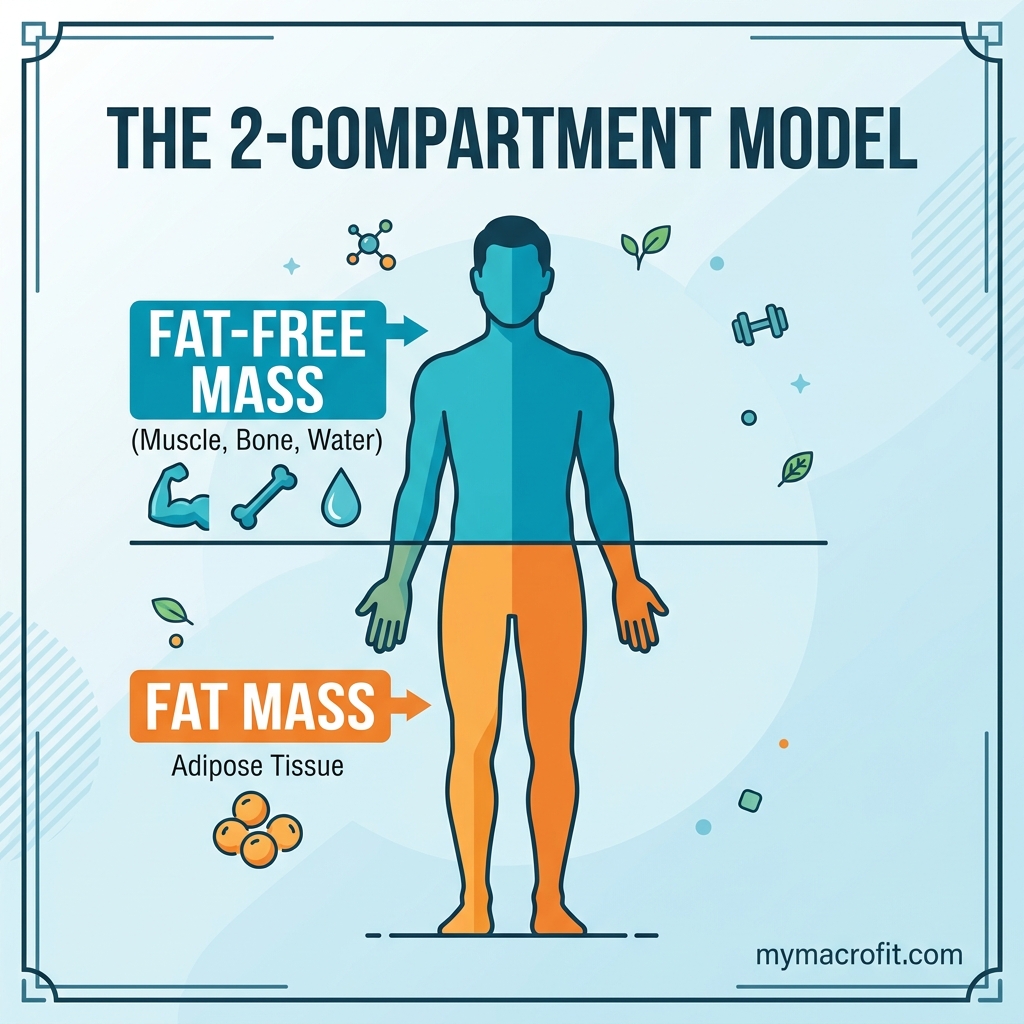
What Is Body Composition?
Body composition is the breakdown of your total body weight into its component parts:
| Component | What it includes |
|---|---|
| Fat mass | Essential fat (required) + storage fat |
| Lean mass | Muscle, bone, organs, water, connective tissue |
The ratio of fat to lean mass is your body fat percentage. This is the metric that meaningfully predicts health outcomes, athletic performance, and how you look in the mirror.
Why BMI Falls Short
BMI (Body Mass Index) = weight (kg) ÷ height² (m²)
It was designed in the 1830s by Adolphe Quetelet as a population-level statistical tool, not as a measure of individual health. Its limitations are well-documented:
- Cannot distinguish fat from muscle, a 180cm bodybuilder at 100kg has an obese BMI (30.9) despite having under 10% body fat
- Doesn't account for where fat is stored, visceral fat (abdominal) is metabolically dangerous; subcutaneous fat (hips, thighs) is largely benign
- Ethnicity bias, the same BMI correlates with different health risks across ethnic groups
- Age bias, older adults typically have more fat and less muscle at the same weight as younger adults
When BMI is useful: Identifying extremes (severe underweight, severe obesity) at a population level. For individual health assessment, it needs to be combined with other markers.
→ Read more: BMI vs Body Fat: Which One Matters?
Body Fat Percentage: The Better Metric
Body fat percentage directly measures what BMI attempts to approximate, the proportion of your body that is fat.
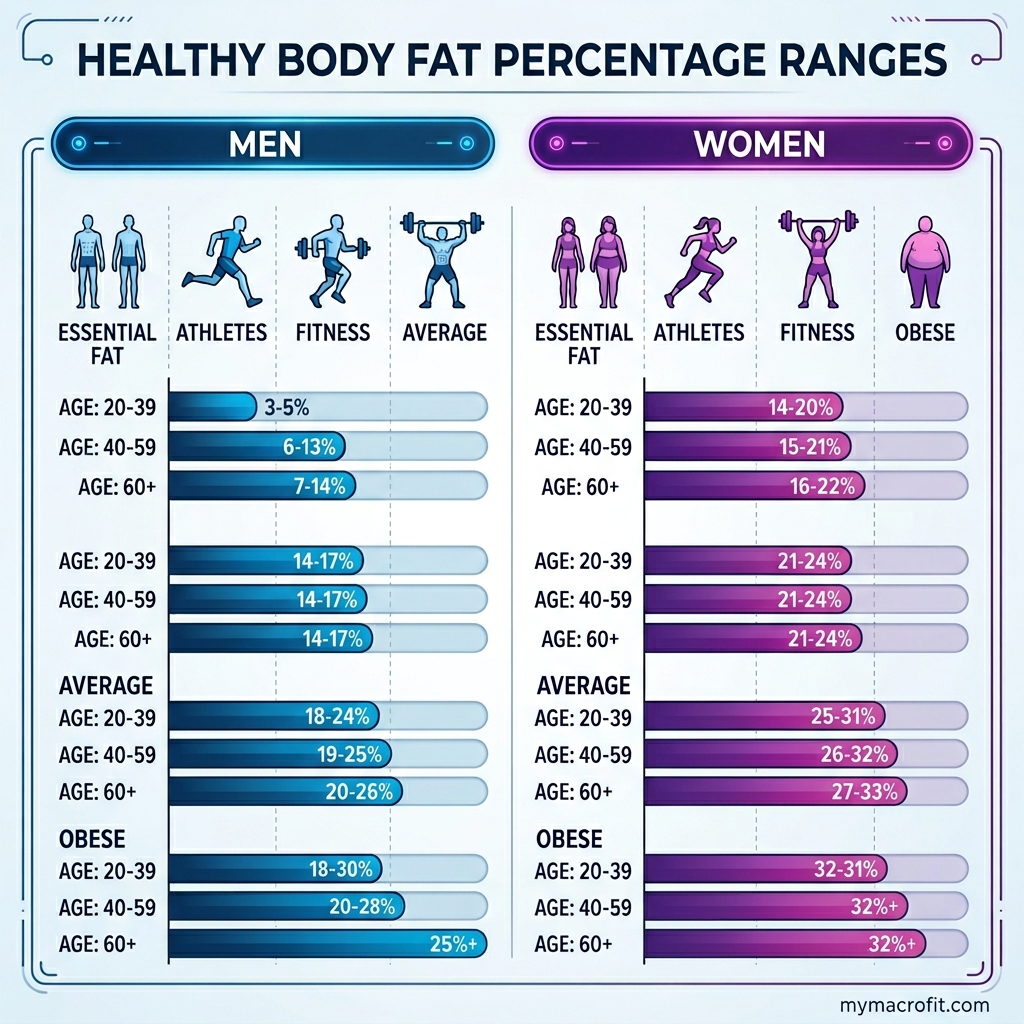
Healthy Ranges
Women:
| Category | Body Fat Range |
|---|---|
| Essential fat (minimum viable) | 10-13% |
| Athletic | 14-20% |
| Fit | 21-24% |
| Average | 25-31% |
| Obese | 32%+ |
Men:
| Category | Body Fat Range |
|---|---|
| Essential fat (minimum viable) | 3-5% |
| Athletic | 6-13% |
| Fit | 14-17% |
| Average | 18-24% |
| Obese | 25%+ |
What These Ranges Mean Practically
Athletic range (14-20% women / 6-13% men): Visible muscle definition. Vascularity in men. This is the range fitness models and competitive athletes typically maintain.
Fit range (21-24% women / 14-17% men): Healthy, active appearance. Some muscle definition visible. This is an excellent long-term maintenance target for most active people.
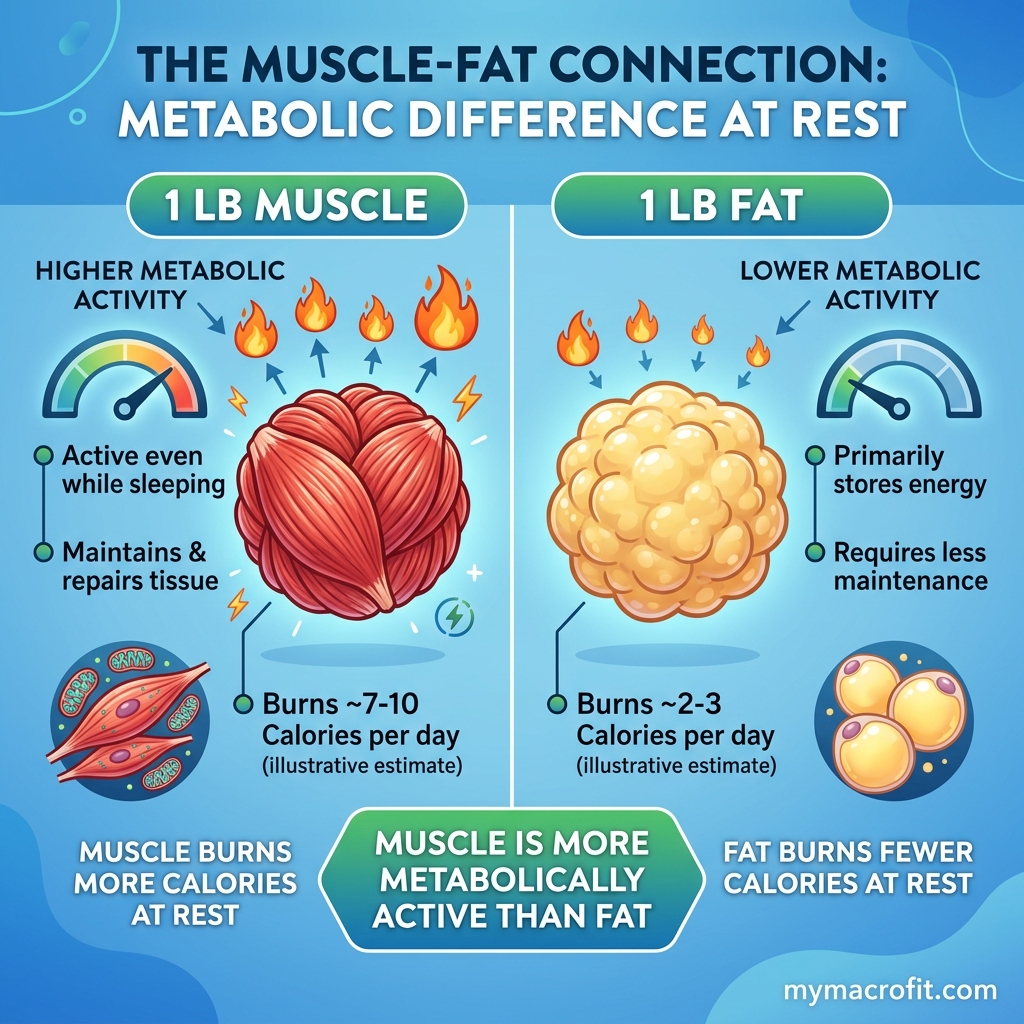
Average range (25-31% women / 18-24% men): Healthy but no visible definition. Associated with good metabolic health if muscle mass is adequate (lean mass matters as much as fat percentage).
Above average / obese: Associated with increased risk of insulin resistance, type 2 diabetes, cardiovascular disease, and metabolic syndrome.
→ Read more: Body Fat Percentage Guide
How to Measure Body Composition
1. DEXA Scan (Gold Standard)
Dual-energy X-ray absorptiometry uses two X-ray beams to distinguish fat, lean mass, and bone mineral density.
- Accuracy: ±1-2%
- Cost: £50-150 per scan
- Where: Private clinics, university sports science labs, some gyms
Recommended for: anyone serious about tracking body composition changes, especially during body recomposition phases where scale weight may not change.
2. Hydrostatic (Underwater) Weighing
Uses water displacement to calculate body density, from which fat percentage is derived.
- Accuracy: ±1.5-3%
- Less accessible, requires specialist facility
3. US Navy Formula (Practical and Free)
Uses circumference measurements to estimate body fat percentage. Accuracy within ±3-5% for most people, sufficient for tracking progress.
For women: Neck, waist, hip measurements + height For men: Neck, waist measurements + height
→ Use the Body Fat Calculator, implements this formula.
4. Bioelectrical Impedance Analysis (BIA)
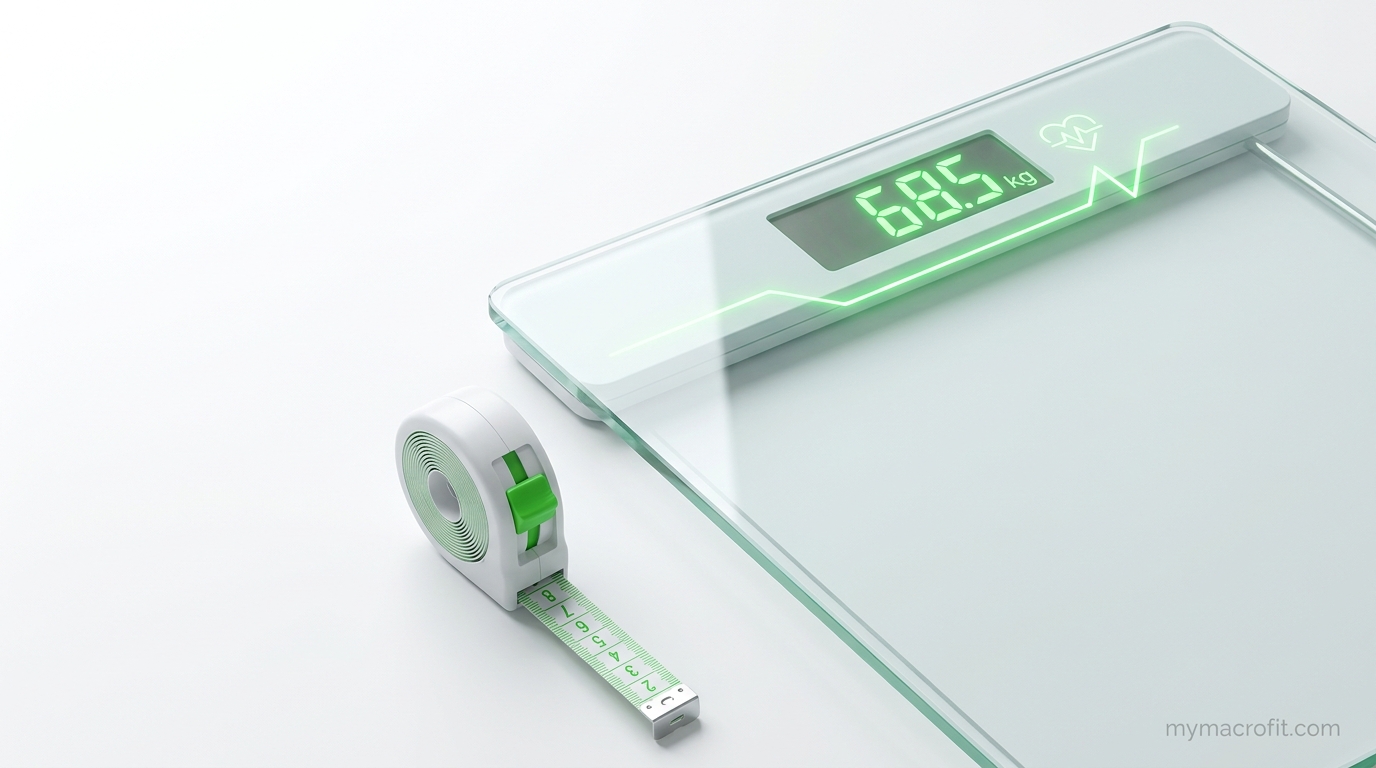
Smart scales and handheld devices that send a small electrical current through the body. Fat conducts electricity differently than muscle.
- Accuracy: ±3-7% (highly variable depending on hydration status)
- Useful for: Tracking trends rather than absolute values
- Best practice: Measure under the same conditions every time (same time of day, same hydration state)
5. Skinfold Calipers
Measures subcutaneous fat thickness at multiple body sites using pinch measurements. Accuracy depends heavily on the skill of the tester.
- Accuracy: ±3-5% when performed correctly
- Inexpensive but technique-dependent
Waist Circumference: Often Ignored, Actually Important
Waist circumference is a better predictor of metabolic disease risk than BMI or total body fat percentage, because it specifically measures visceral fat accumulation.
High-risk thresholds:
| Women | Men | |
|---|---|---|
| Increased risk | ≥ 80 cm (31.5 in) | ≥ 94 cm (37 in) |
| Substantially increased risk | ≥ 88 cm (34.6 in) | ≥ 102 cm (40 in) |
Waist-to-height ratio is even more predictive: waist circumference should be less than half your height. A 170cm person's waist should be under 85cm.
→ Read more: BMI Chart: What the Numbers Mean

Body Recomposition: Changing Composition Without Changing Weight
It's entirely possible, particularly for beginners and those returning to training, to simultaneously lose fat and gain muscle at the same or similar body weight. The scale stays the same; body composition improves.
Signs you're recomposing successfully:
- Clothes fit differently (smaller at the waist, larger in shoulders/glutes)
- Physical measurements change (waist decreases, thigh/arm increase)
- Strength increases while weight is stable
- Body fat percentage decreases on tracking device
Recomposition works best with:
- High protein (2g/kg minimum)
- Consistent progressive overload training
- Near-maintenance or very mild deficit calories
What to Actually Track
If you want to monitor body composition progress, use this combination:
| Metric | Frequency | Tool |
|---|---|---|
| Body weight | Weekly (morning, same conditions) | Scale |
| Waist circumference | Monthly | Tape measure |
| Body fat % | Monthly | Navy formula or BIA scale |
| Progress photos | Monthly | Consistent lighting/position |
| Strength lifts | Each session | Training log |
Weight alone is noisy (fluctuates 1-3kg daily from water, food, hormones). Combination tracking gives a complete picture.
All Articles in This Guide
- BMI Chart: What the Numbers Mean
- BMI vs Body Fat Percentage
- Body Fat Percentage: What It Means and How to Lower It
Sources
- DEXA as gold standard for body composition, Shepherd et al., British Journal of Nutrition, 2005
- BMI limitations as a health metric, Romero-Corral et al., International Journal of Obesity, 2008
- Waist circumference and health risk, WHO Technical Report, 2008
- NHS: Waist circumference guidance, NHS, 2023
Save & share on Pinterest
Click any card to pin it — or share with someone who needs it.
The Complete Body Composition Guide: BMI, Body Fat, and What to Actually Track
A comprehensive guide to understanding body composition, what it is, how to measure it, what BMI get…
A comprehensive guide to understanding body composition, what it is, how to meas…
Read the full guide: The Complete Body Composition Guide: BMI, Body Fat, and What to Actually Track
Free fitness tools
The Complete Body Composition Guide: BMI, Body Fat, and What to Actually Track — use our free calcul…
Pinterest opens in a new tab. You can edit the description before saving.
Frequently Asked Questions
What is body composition?+
Is BMI accurate for measuring body fat?+
What is a healthy body fat percentage?+
What is the most accurate way to measure body fat?+
About the Author

I'm a registered health coach and pre/postnatal specialist. I look at the whole person, your sleep, your stress, your hormones, because the number on the scale is only ever part of the story.
View full profile →